01
Apr 2026
Netflix Content Library Analysis
- Power BI, Power Query, DAX
What I did
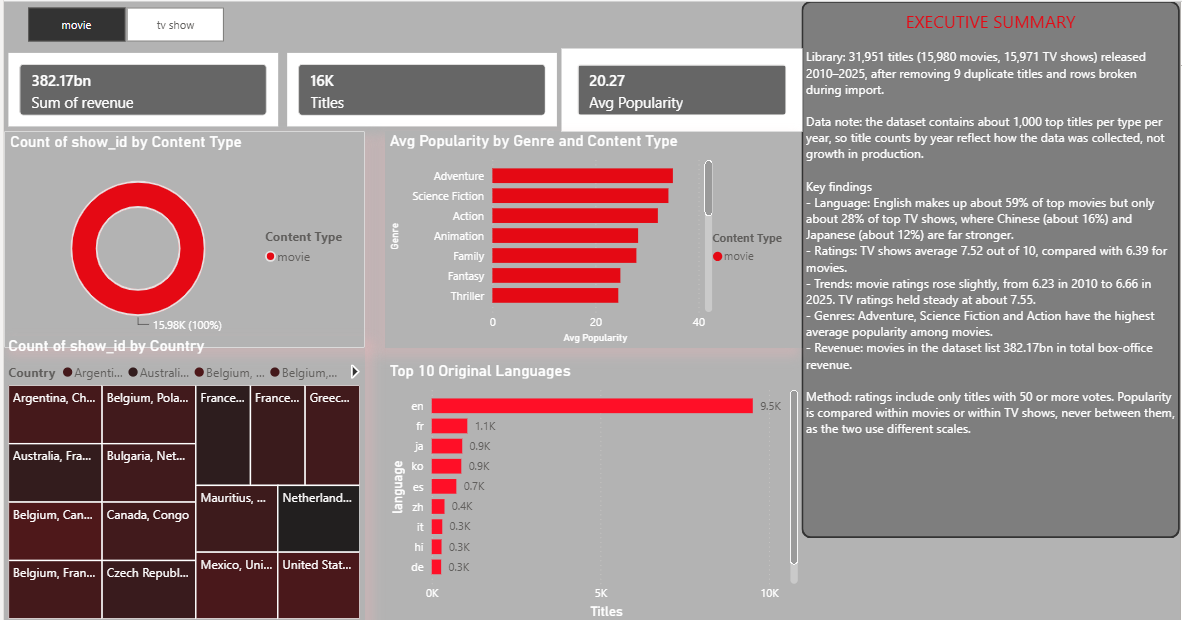
- Analyzed 31,951 movies and TV shows released 2010–2025 in a 5-page Power BI report with a movie/TV toggle, drill-through and custom tooltips.
- Cleaned the data in Power Query: removed rows broken during CSV import, corrected data types, removed 9 duplicate titles, and split multi-genre values into a linked genres table.
- Wrote DAX measures for titles, average rating and average popularity, excluding titles with fewer than 50 votes so ratings reflect reliable data.
- Identified that the dataset holds 1,000 top titles per year, and replaced charts that implied false growth trends.
Key findings
- English makes up about 59% of top movies but only about 28% of top TV shows.
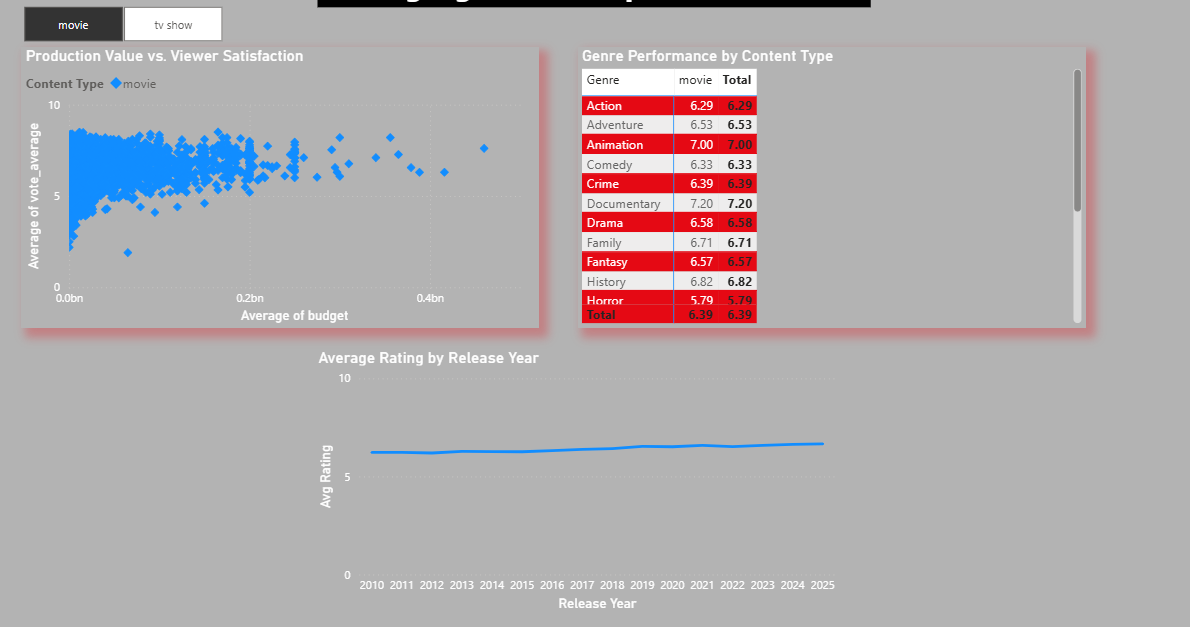
- TV shows average higher ratings (7.52) than movies (6.39).
- Movie ratings rose slightly from 6.23 in 2010 to 6.66 in 2025, while TV ratings held steady at about 7.55.
02
2026
How Much Does It Cost to Save Lives? — USAID SCMS Supply Chain Analysis
- Excel, MySQL, Power BI
What I did
- Analyzed ~10,000 USAID SCMS health commodity shipment records, cleaning the data in Excel and importing it into MySQL for querying.
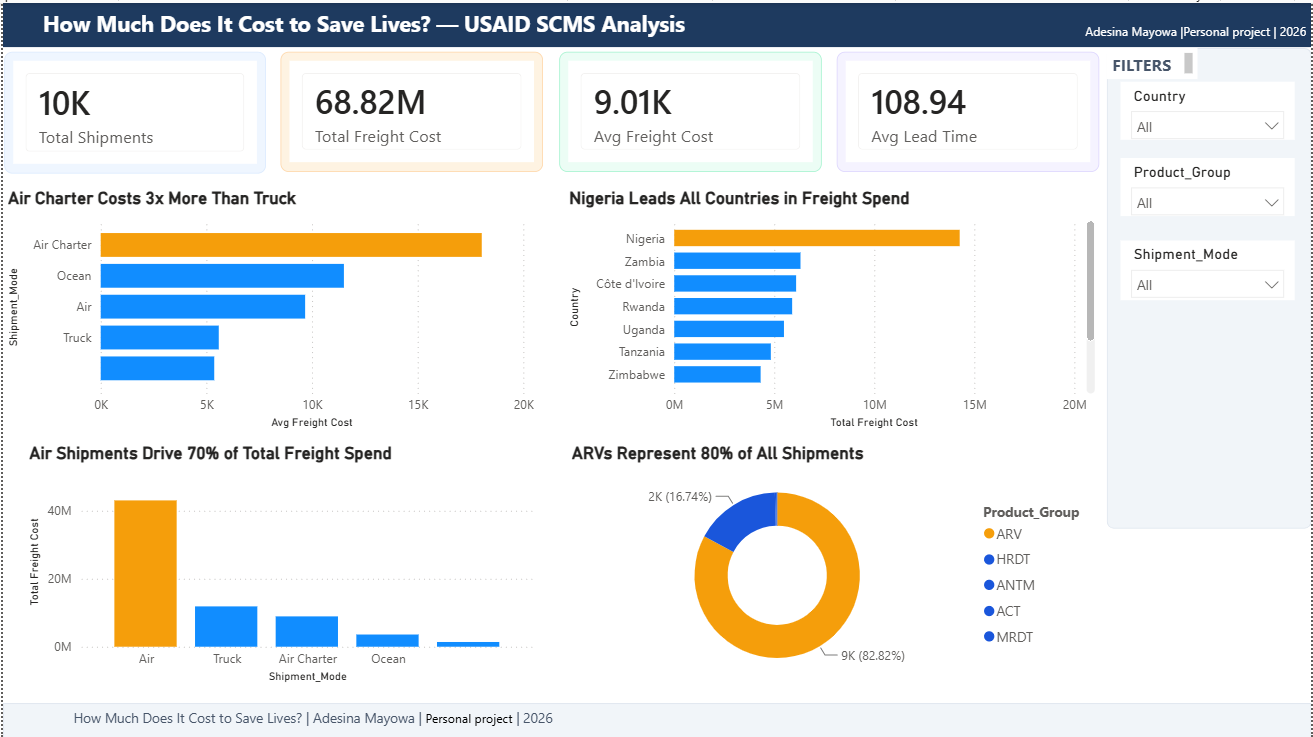
- Built an interactive Power BI dashboard with 4 KPI cards (including $68.8M total freight cost and a 108.9-day average lead time), 4 charts and 3 slicers for country, product group and shipment mode.
Key findings
- Air shipments drove 70% of total freight spend, with air charter costing about 3x more per shipment than truck, pointing to savings in shipment mode choice.
- Nigeria was the highest freight spender of all countries, and antiretrovirals (ARVs) made up over 80% of all shipments.