
01
The design challenge
Stock quantity alone does not tell someone what to do
An inventory list can show numbers and still leave the user uncertain. A quantity only becomes useful when it is connected to context: the item's location, its reorder point, recent movement, supplier information, and the action available from its current state.
The project did not begin with documented user interviews, surveys, or usability testing. The decisions in this case study are therefore presented as product hypotheses and interface rationale, not validated research findings.
01
Show health before detail
Reveal the state of inventory before asking the user to search.
02
Treat movement as a primary action
Make additions, removals, corrections, and receipts easy to record.
03
Keep depth close, not crowded
Keep suppliers, locations, purchase orders, and counts reachable without overloading navigation.
04
Make every state understandable
Design permission, loading, empty, warning, error, success, and confirmation states as part of the product.
02
Product structure
Four primary destinations keep operational depth manageable
Vaultly contains more operational areas than a mobile navigation bar can comfortably hold. Giving every feature equal weight would make the product harder to scan and make frequent actions compete with occasional tasks.
I organised the main navigation around Dashboard, Scan, Inventory, and Settings. Supporting areas—including alerts, reports, locations, suppliers, purchase orders, cycle counts, and activity—sit behind contextual links and dashboard actions.
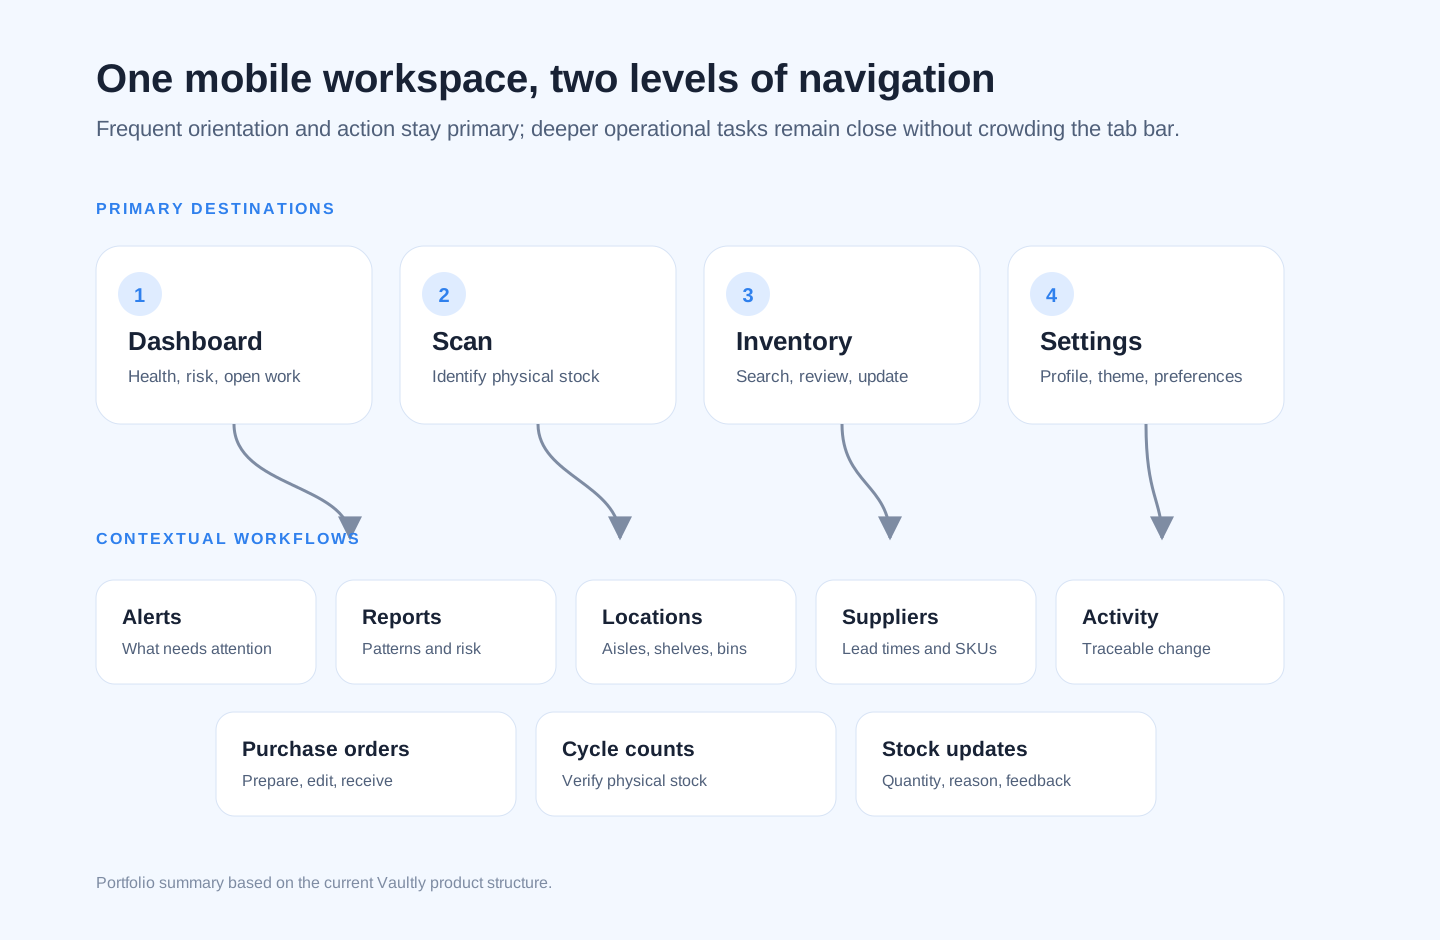
Frequent orientation and action stay primary; deeper operational tasks remain close without crowding the tab bar.
The structure separates two kinds of work. The main navigation supports frequent orientation and action. Secondary routes support deeper tasks that begin with a specific need, such as investigating low stock or receiving a purchase order.
03
Introducing the value
Benefits before features
The onboarding experience uses three short benefit statements rather than a long feature tour: start tracking quickly, stay ahead of low stock, and keep a record of every movement.
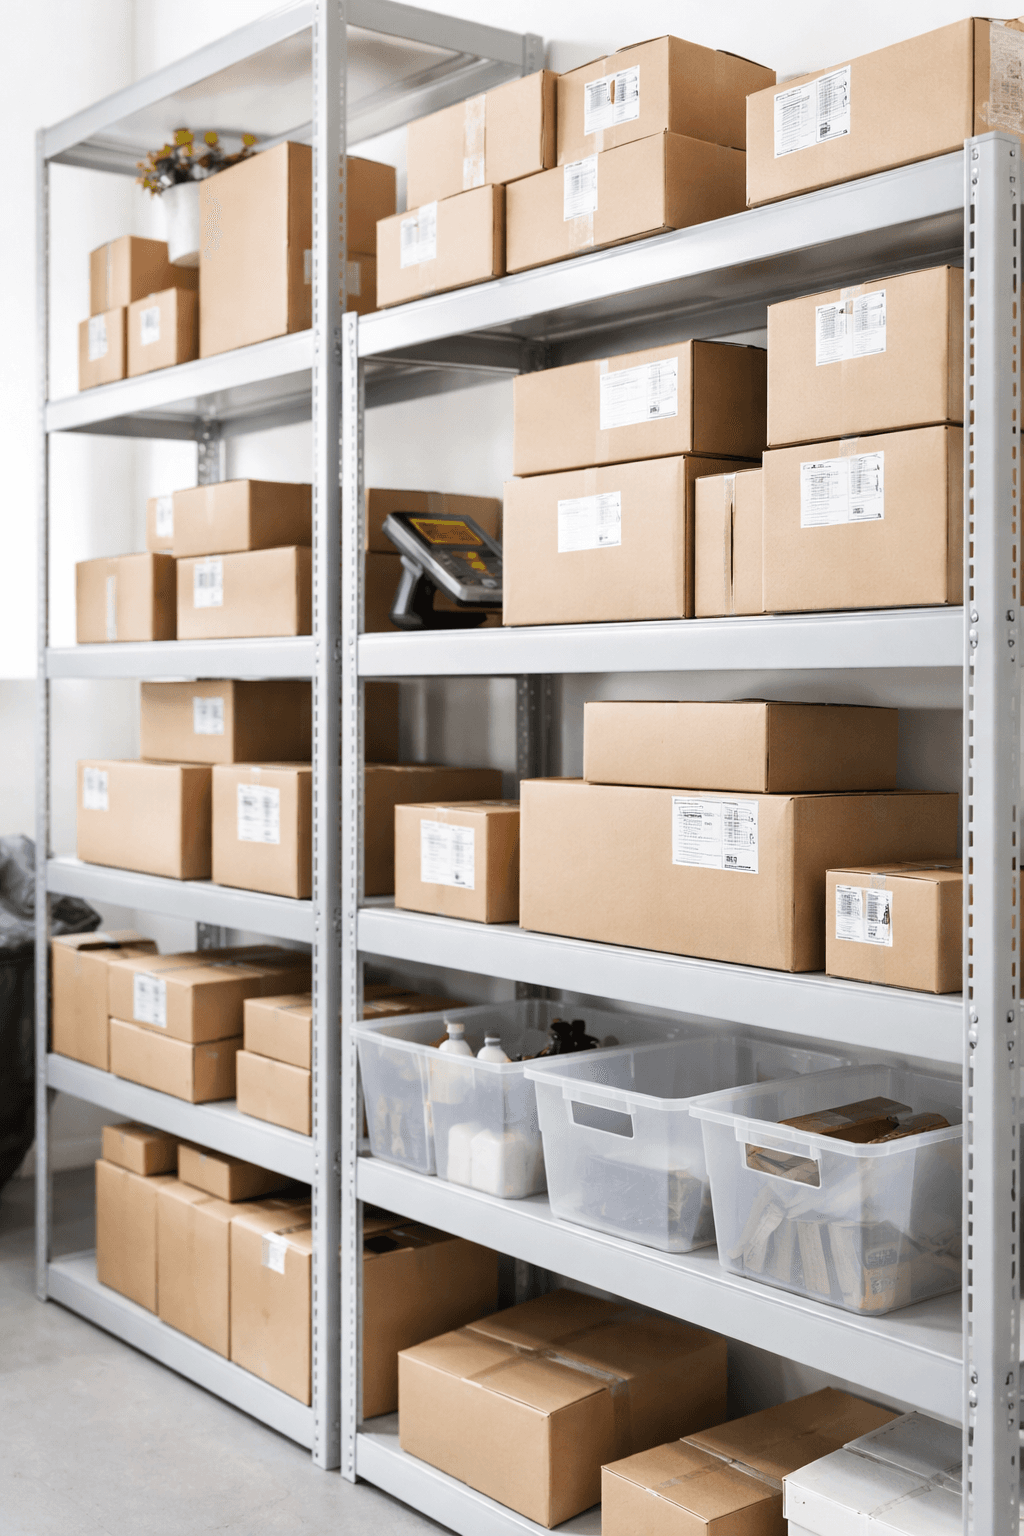
Start quickly
Establish the physical inventory context before setup begins.
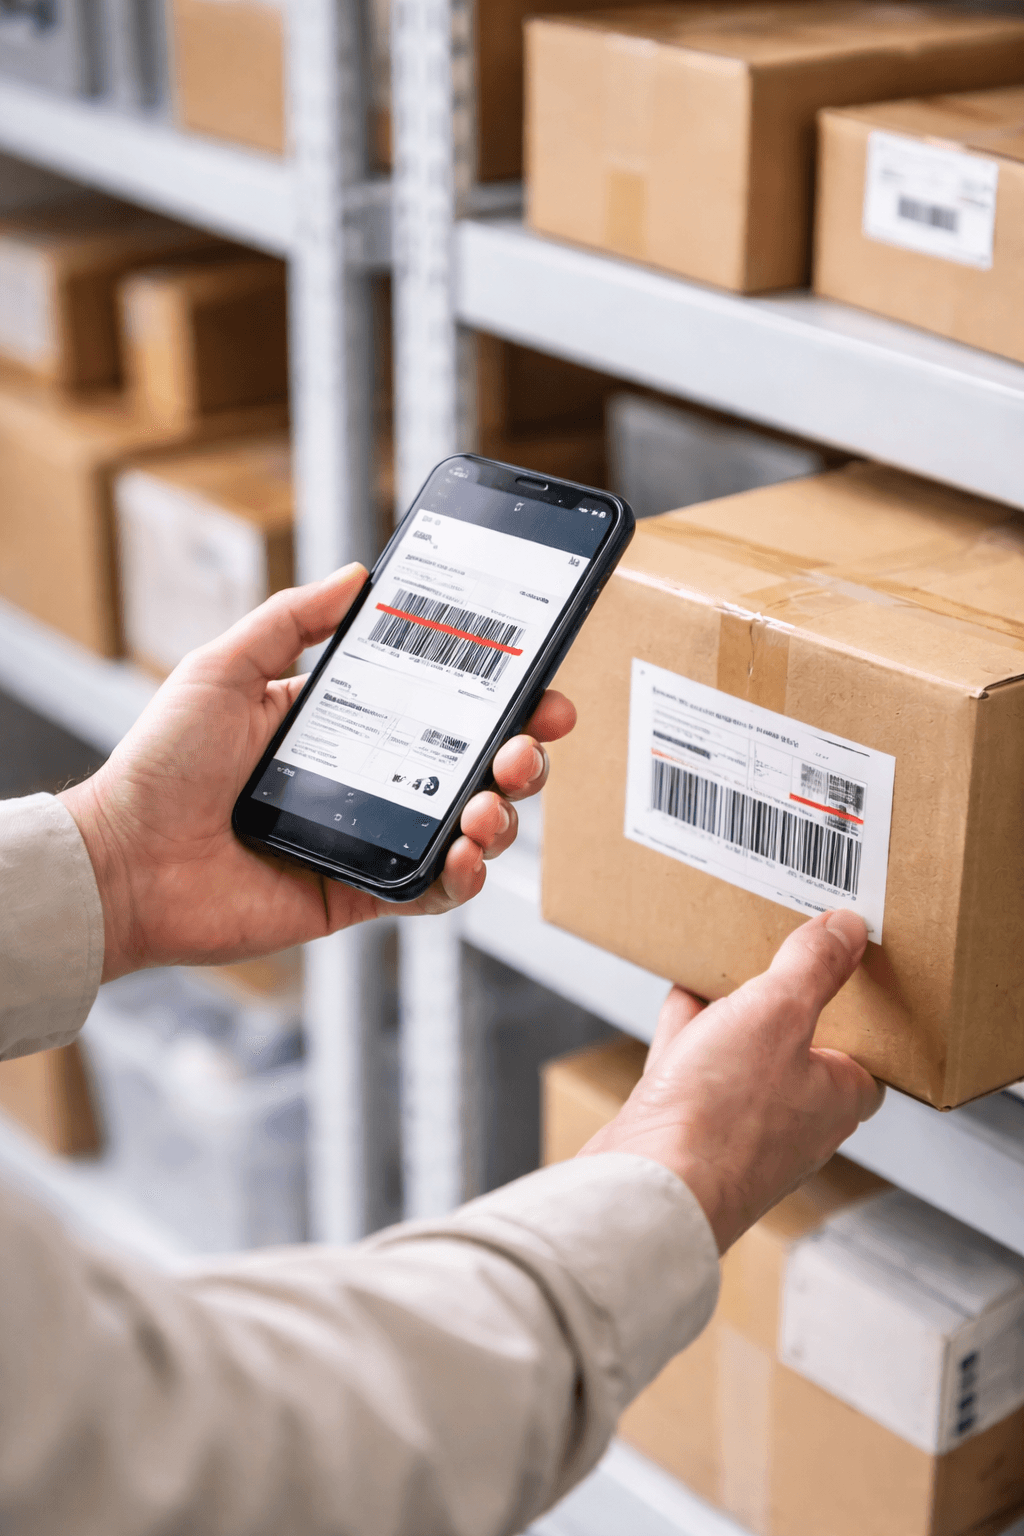
See low-stock risk
Connect mobile interaction to real stock on the shelf.

Trace movement
Close with the person responsible for inventory decisions.
Each screen combines full-bleed warehouse imagery with one clear statement, a short explanation, progress indicators, and a single dominant action. The imagery establishes the physical environment of the product, while the copy moves from setup to visibility to accountability.
The final screen separates new and returning users. “Get started” remains the primary action, while “I already have an account” stays visible without competing for equal emphasis.
04
High-fidelity product screens
The product interface is the high-fidelity design
Vaultly was designed directly as a working mobile prototype, so the product itself is the strongest source of high-fidelity evidence. These captures show the current interface at a 390 × 844 mobile viewport using seeded sample inventory—not separate Figma mockups and not evidence of a public launch.
Together, the screens show how the visual system holds across orientation, risk, reporting, physical organisation, supplier context, and ongoing stock verification.
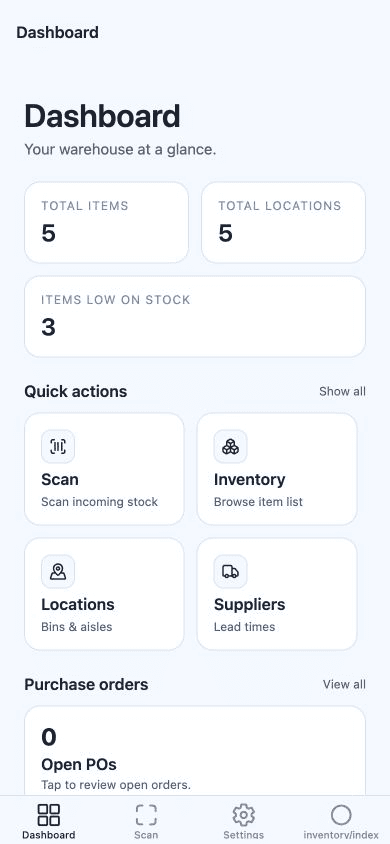
Dashboard
Inventory health, operational shortcuts, open orders, and recent movement in one overview.
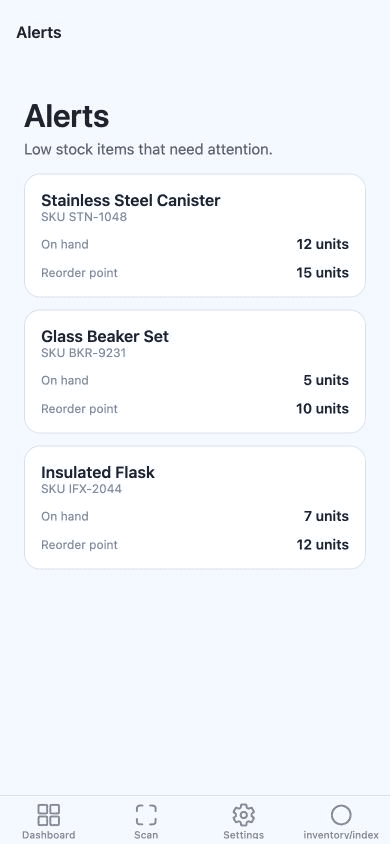
Low-stock alerts
On-hand quantities are shown beside reorder points so each warning has immediate context.
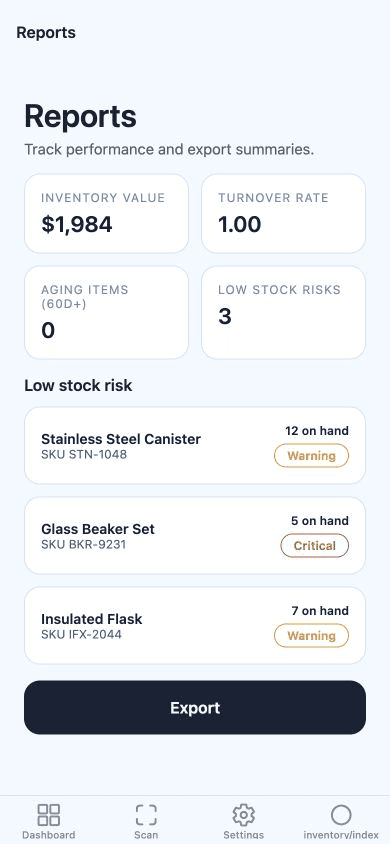
Reports
A compact summary combines inventory performance with the items that require attention.
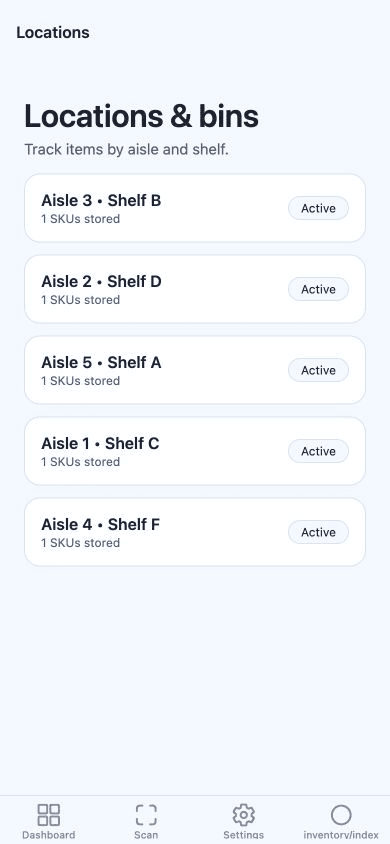
Locations and bins
Physical storage context stays legible without turning the screen into a dense warehouse table.
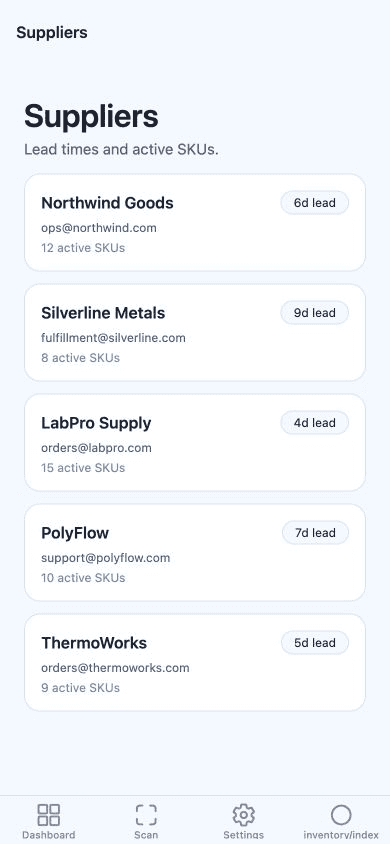
Suppliers
Lead time and active-SKU context support replenishment decisions beyond the stock number.
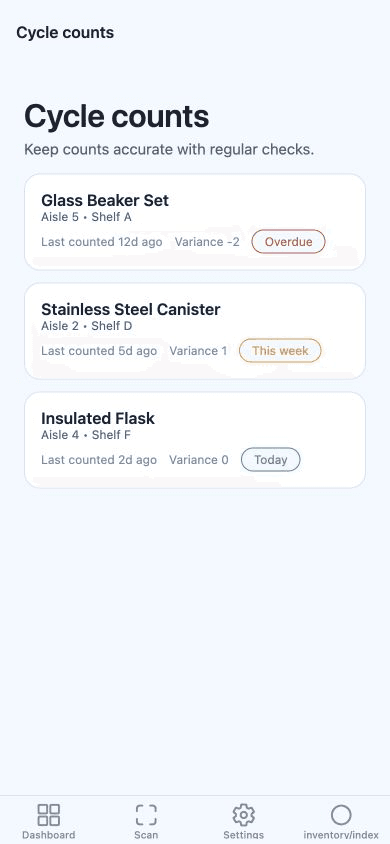
Cycle counts
Due status and variance help teams verify that recorded inventory still matches physical stock.
05
Designing the dashboard
An overview that leads somewhere
The dashboard answers three questions in sequence:
- What is the current state of inventory?
- What needs attention?
- What can I do next?
Summary cards surface total items, storage locations, and low-stock items. Their purpose is orientation, not deep analysis. Quick actions then connect the overview to common tasks such as scanning stock, browsing inventory, checking locations, and reviewing suppliers.
The first four actions appear immediately; a “Show all” control reveals less frequent workflows. This progressive disclosure keeps the initial screen focused while allowing the product to support more operational depth. Open purchase orders and recent activity add time and accountability to the snapshot: the user can see not only what exists, but what is expected and what has recently changed.
06
The core inventory journey
Connecting physical stock to a traceable action
Scanning is the fastest bridge between a physical item and its information. The core sequence moves from seeing inventory health to identifying an item, reviewing its context, recording a movement, and deciding what should happen next.
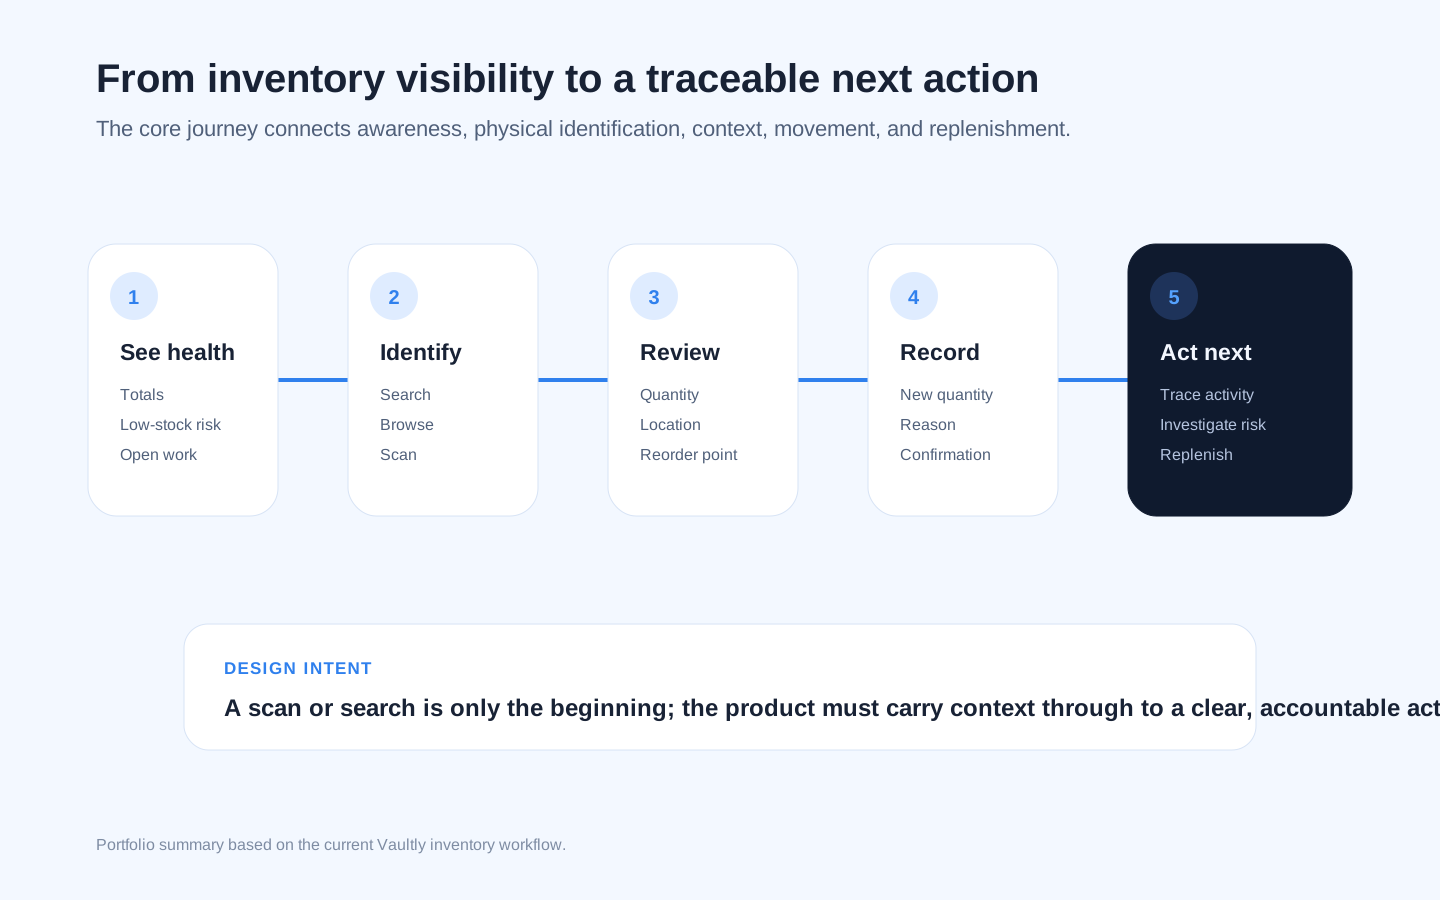
A scan or search is only the beginning; context must carry through to a clear, accountable action.
The camera view removes unrelated interface elements and uses a clear frame to guide positioning. Short instructions explain what the user should do. Permission, unavailable-camera, and retry states provide a path forward when the ideal interaction cannot continue.
The stock-information screen becomes the transition point between identification and action. Instead of changing quantity immediately, the user first sees the item and its current state. The update flow separates the proposed quantity from the reason for the change, helping the action feel deliberate rather than accidental.
07
Inventory and replenishment
Turning item context and low-stock risk into a next step
The inventory experience supports both browsing and direct search. The list includes loading, refresh, empty, error, and no-results states so the interface continues to explain what is happening even when there is no item to display.
At item level, the design brings together the name, SKU, quantity on hand, reorder point, storage location, supplier relationship, and stock-adjustment action. Reference information stays visually separate from the controls that change it.
When stock is updated, the interaction asks for both the new quantity and a reason such as receiving, transfer, damage, or count correction. Confirmation and success feedback complete the action. This creates a stronger foundation for accountability than a quantity field alone.
Low-stock alerts connect risk to a broader replenishment model: low-stock signal, item context, supplier, purchase order, receipt, and updated stock. Alerts distinguish warning and critical states rather than presenting every shortage with the same urgency. Supplier and purchase-order views give the warning somewhere useful to lead.
08
Visual system and interface states
A calm system that keeps operational meaning visible
The interface uses a restrained blue system built around soft backgrounds, white cards, dark navy text, and semantic colours for success, warning, and danger. A clear type-size hierarchy keeps headings, labels, and stock values easy to scan.
A consistent spacing scale and corner radius unify cards, controls, and content groups. Light and dark modes preserve the same information hierarchy, with status colours adjusted so alerts remain legible without becoming visually aggressive.
Light canvas
Working background
#F3F8FF
Navy ink
Primary reading colour
#182235
Action blue
Primary interaction
#2F80ED
Warning amber
Low-stock attention
#D79A2B
The active prototype uses a 12–32 pixel type scale: concise labels, compact card titles, and larger inventory values. The same hierarchy carries into its dark theme.
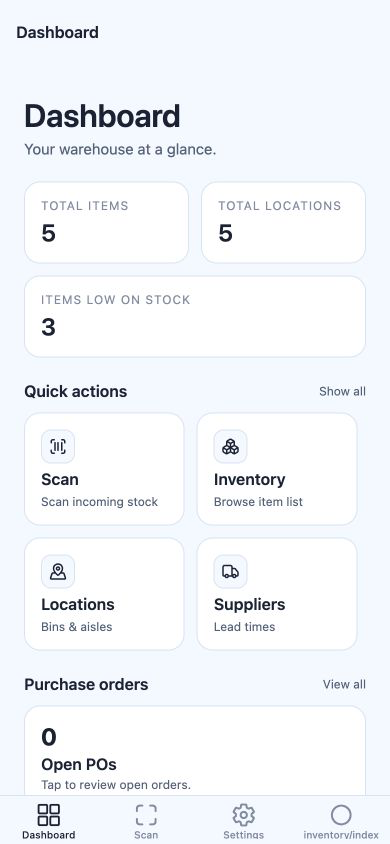
Open the existing screen at full size.
Metric cards
Group totals, low-stock risk, and open work in a scannable dashboard.
Quick actions
Keep scan, inventory, locations, and suppliers one tap away.
Explicit states
Give permission, empty, warning, error, and success moments clear next steps.
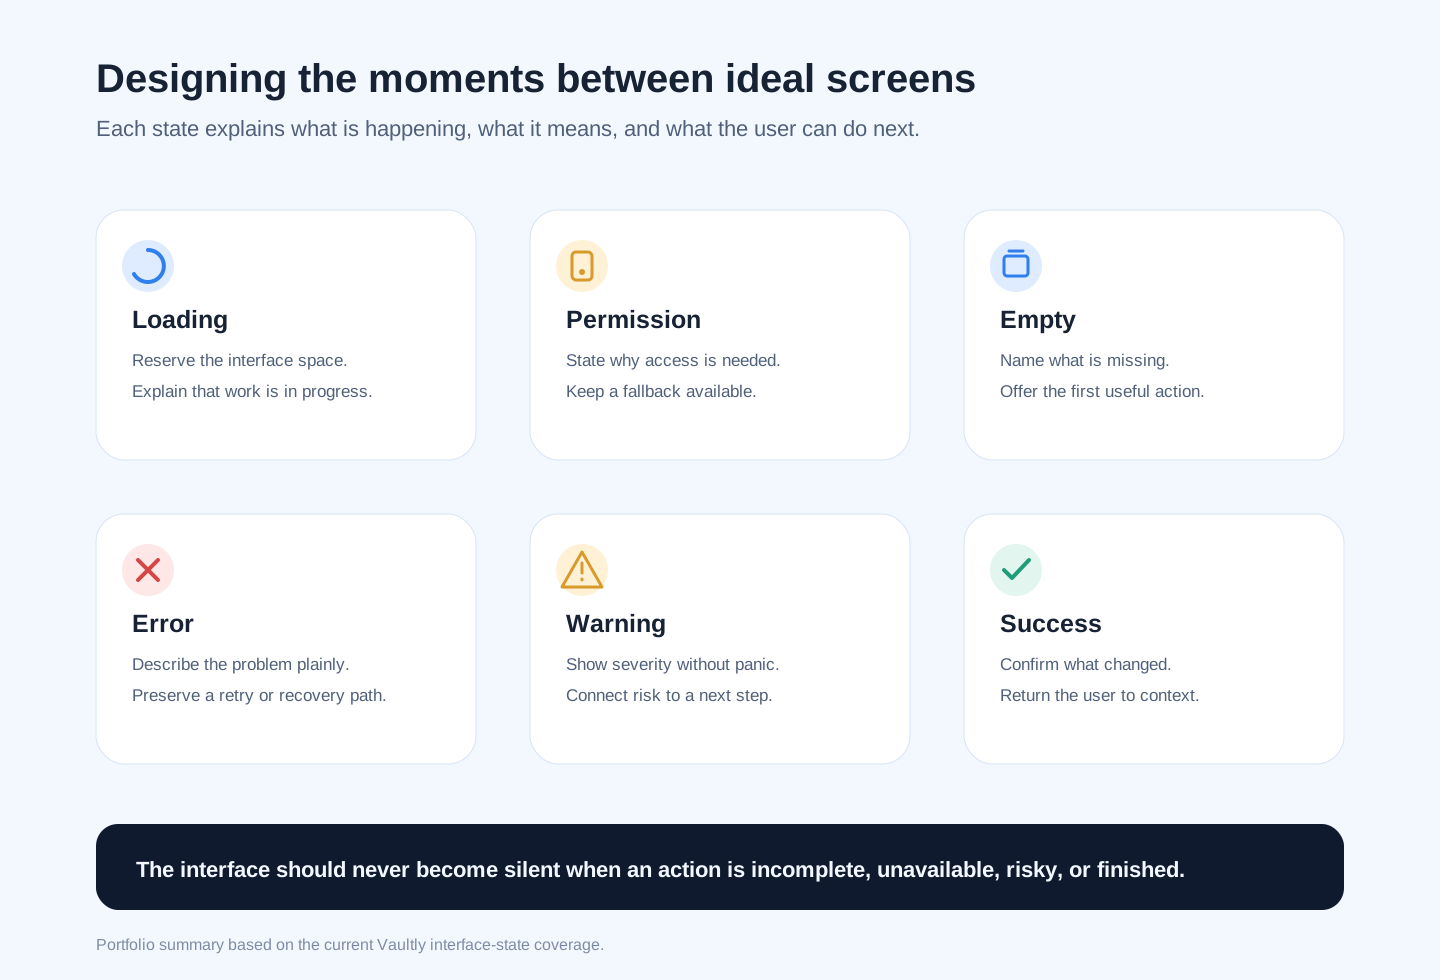
The interface explains what is happening, what it means, and what the user can do next.
These states prevent the product from becoming silent when something is incomplete. They also make the intended behaviour easier to evaluate before the product reaches real-world testing.
09
Supporting operational accuracy
Movement records explain change; cycle counts verify reality
Inventory accuracy is not maintained only when stock arrives or leaves. Locations organise items by aisle, shelf, or bin, helping users understand where something belongs rather than treating the warehouse as one undifferentiated quantity.
Cycle counts surface what needs to be checked, when it was last counted, and whether a variance exists. This adds a second form of confidence: movement records explain what users said changed, while cycle counts help verify whether physical stock still matches that record.
10
Reflection and next steps
The value is in the loop, not an isolated inventory screen
The strongest part of Vaultly is the way its screens form an operational loop. The dashboard creates awareness. Search and scanning identify an item. Stock updates and cycle counts record or verify change. Alerts and reports reveal risk. Suppliers and purchase orders provide a path toward replenishment.
The breadth of the system also introduces many secondary workflows, so real users should help determine which ones deserve prominence. Terminology such as stock movement, cycle count, and reorder point should be checked with the small teams the product is intended to support.
Limitations
Vaultly has not been launched, and there is no verified adoption, revenue, retention, accuracy improvement, or business-impact data. The project also has no documented discovery study or usability test, so the rationale shown here remains a set of design hypotheses.
The barcode journey, onboarding continuity, terminology, navigation priorities, and wider replenishment model still need validation with realistic inventory scenarios.
What I'd test next
- Understand inventory health from the dashboard.
- Find or scan an item.
- Record a stock change with confidence.
- Identify a low-stock risk.
- Prepare and receive a replenishment order.